

Logging using JSON Logger in MuleSoft
JSON Logger (MuleSoft)
Overview:
- JSON Logger is used for logging purpose in MuleSoft.
- JSON Logger is used to create and display the logs in JSON Format.
- There will be an auto-generated correlation ID in the logs.
- The logs generated by JSON Logger are in a more readable format.
Now let’s configure our Mule application to use the JSON Logger and see the demo about the features provided by it.
Step 1:
- Open the Anypoint Studio create a Mule project and provide a name for the project.

Step 2:
- Now drag and drop a Flow and add an HTTP listener to it to create a source listener to get the mule event for the application.

Step 3:
- Now we need to configure the HTTP listener by providing the connector configuration and path.
- In connector configuration we need to provide the below details.
- Protocol: HTTP or HTTPS
- Host: All Interfaces[0.0.0.0](default)
- Port:8081
- Rest we can leave as default.
- Then hit OK.

- For path we can define any resource path following “/”.(Example: /JLTest)

Step 4:
- To add the JSON Logger we need to have an active account on Nexus Repository. From there we can get the dependency for the JSON Logger and we can add it to the POM.xml file of the application to use the JSON Logger.
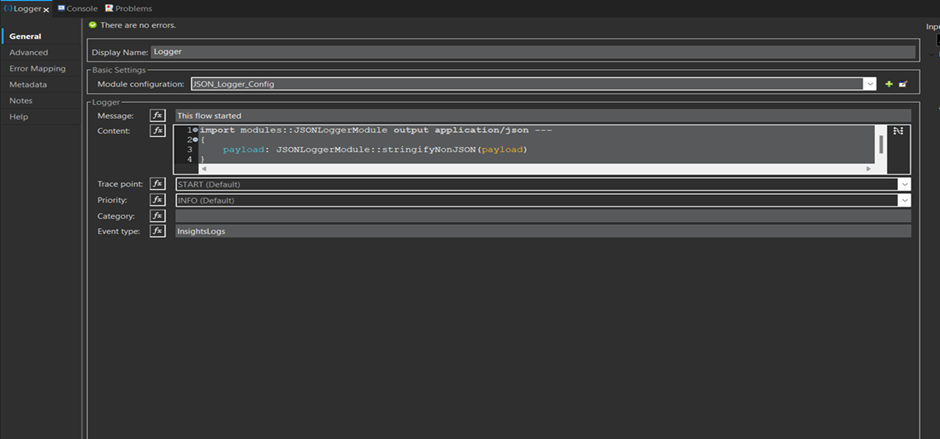
- We are using the JSON Logger for the demo. We need to drag it to the mule flow.
- In the JSON Logger we need to some basic configuration.
- Module configuration:
- In connection we need to provide application name, application version and environment fields as these are mandatory.
- All these filed values can be derived from properties file or we can give the static value as well.
- Application name: ${json.logger.application.name}
- Application Version: ${json.logger.application.version}
- Environment: ${mule.env}
- We need to create properties file on main/resources and define key value pairs in order to populate the values to the above placeholders.


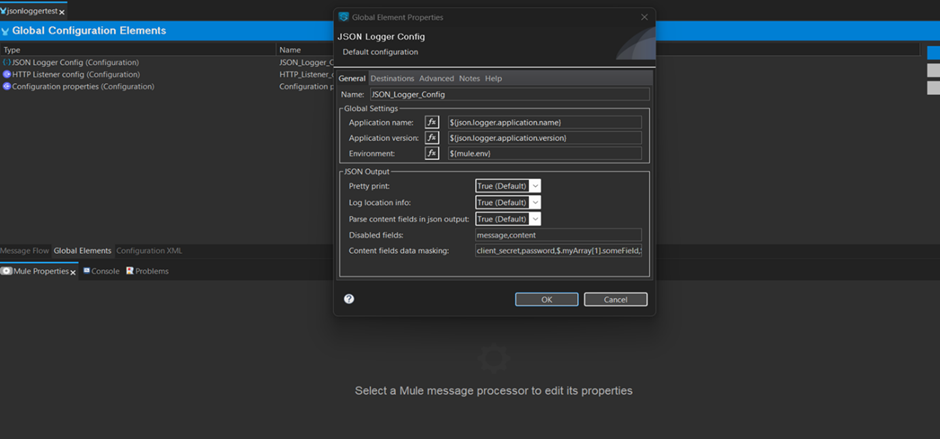
- Pretty Print-> It is used to print the logs in an accurate JSON format.
- Trace point -> Basically used to track the log in the flow as START,FLOW,EXCEPTION,END,BEFORE_REQUEST,AFTER_REQUEST,BEFORE_TRANSFORM,AFTER_TRANSFORM

- Priority -> The level or priority of the log as INFO,DEBUG,ERROR,TRACE,WARN

- log location info-> In the log message we can see the location of the JSON logger component.

If we don’t want the location to be logged, we can set log location info to false in the connection.


- Disable fields-> Disable fields are used to hide the fields from log which will be displayed.


We can hide multiple fields. We need to define the fields as comma separated values.


- Content Fields data masking-> If we want to mask the fields of a payload, we can make use of content field data masking in the connection.
There we need to specify the particular field in below format.
Ex- $..age


We can also add multiple fields as comma separated values.
Ex-$..age,$..location


- It is only applicable for the JSON payload. If we pass any other format data it will be not masked.

- The complete configuration of JSON logger will look like below.
- JSON logger can be also used to send the data to different destinations like the Splunk dashboard for data visualisation or graphical representation.
Payload used in this Demo are :
JSON Payload

XML Payload
