As there are three types of modes in Boomi, In this blog, we will learn about Boomi’s new mode, Bridge mode, and the differences between Bridge, General, and Low Latency modes.
Bridge Mode: A new process mode called Bridge has been introduced for Integrations. This mode of execution provides low latency-like performance with more granular process logging.
Difference between General, Low Latency, and Bridge modes.
In this use case, we have choose mode as Bridge Mode and taken a Start shape of connector type and used Web Services Server as a connector as we are exposing an API and then we have taken a disk v2 connector as we are getting files from our local directory and then we use branch shape in the first branch we are send the data in Database using flow control shape to send document one by one and taken map shape to transform the data and send it to Database using Database V2 connector and In second branch we are just combining the document using Data Process shape and the taken Message shape to generate a message as response and taken a Return document shape to return the document
We will see how Bridge Mode works and how it is different from other Modes in Boomi, with the help of this use case. Step 1: Now, log onto the Boomi platform (https://platform.boomi.com/) with the required credentials i.e. Email Address and Password.
Step 2: Now Click on Integration
Step 3: Create a Component
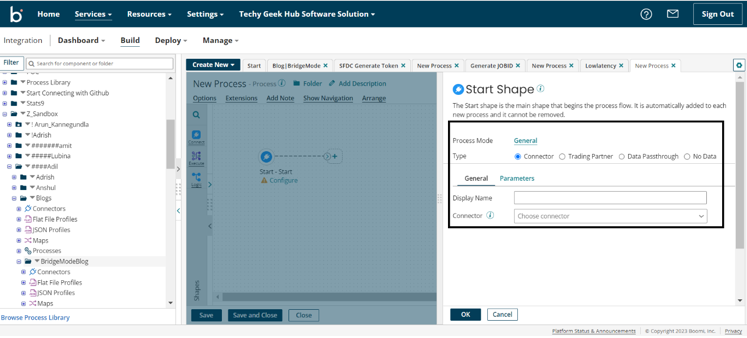
Step 4: Choose a start shape of connecter type.
Step 5:Choose Mode as Bridge Mode by clicking on the Options Tab.
Step 6:Here I have exposed An API by using Web Services Server Connector.
Step 7:Here is the operation for this API, We will get a single data as a response, so we will response output type as Single Data and will choose operation type as get and give object name as Bridge
Step 8:Here we have taken Disk V2 connector with Action as Query and we are getting 1000 documents of Employee having fields ID, Name, PhoneNumber, Country
Step 8.1: Here, We will configure Disk V2 Connection. For configuring Disk V2 connection we have to click on the plus symbol.
Now we have to give the connection name and path where the file resides in our local directory
Step 8.2: Here, We will configure Disk V2 Operation. For configuring Disk V2 operation we have to click on the plus symbol.
Now we have to give the operation name and import the file after clicking on Import
This is the sample of file we are getting from our disk connector
Step 9:Now, we have taken a branch shape.
Step 10:Now, we have taken a flow control shape and configured it to run each document individually
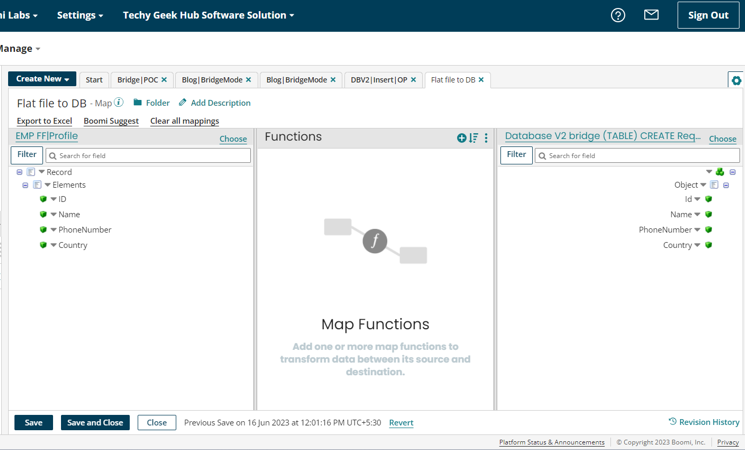
Step 11:Now, We have taken a MAP shape to mapped the values and sent it to DataBase Using the Database V2 connector
Step 11.1:Now, We configure the MAP shape by getting the source profile and target profile and mapping them • First we have click on choose to choose the profile type and create or import a profile
• Now we choose the profile type and click on plus sign to create or import a profile as we are having profile type as flat file we will choose profile type as Flat File
• Now we have to give our profile a name and click on import to import the profile
• Now, We have to choose the sample file from our directory which we want to import
• Now, for getting our Target profile we have to configure the Database connector as we are sending data to Database, so we have taken Database V2 as a connector.
• Now, we have chosen Insert as an action and click on connection to connect with the Database.
• In this Process, we are using My Sql as a database so for this we need MySql Jar file according to the version we are using, for that just download the jar file from this link (https://mvnrepository.com/artifact/mysql/mysql-connector-java) and refer to this blog (https://drive.google.com/file/d/168UmtyVSyIEn4sWe_fqUzkZAmrdnmZnM/view) and instead of SQL server jar just use MySql jar file and follow the same steps and after that go to database v2 connection. Here give your connection a name and fill the required fields like class name, user name and password and click on test connection to test the connection.
• Now, go to operation, give your operation a name, and import the table where you want to insert the Data.
• After that choose your Atom and fill the schema name and in filter give the table name and your Import the table and you table will be imported.
• Now we will get two Json profile one will be request and one will be response
• So the profile that we are getting in request we will choose the same profile in our map in the target profile and now we have to choose profile type as Json and in profile we have to choose same request profile we got in while importing table in Database V2 connector.
• This our Source and Target profile.
• Now we have to mapping as shown below
Step 12: After the Map shape we have to take the same Database that we have configured and after that we will use a stop shape.
Step 13: In the next Branch we have taken the Data Process shape and combined the document that is coming from the Disk V2.
Step 14: After Data Process Shape we have taken a message shape to generate a response message of the API.
Step 15: After the Message shape we used the Return document shape to return the response.
Step 16: We Created Packaged component by clicking on Create Packaged Component.
Step 17: We click on next details.
Step 18: We Click on Create Package component.
Step 19: After that we get a Pop-up to deploy the Process and we have to click on deploy..
Step 20: After that we have to Select an environment where our atom is attached and click on next select version.
Step 21: After that we have to click on next review.
Step 22: After that we have to click on next review.
Step 23: After clicking on view deployment we can see our deployed process.
Step 24: As we have exposed an API we have to test it in Postman using.
For testing it in Postman we need the Base URL, We will get base url from Manage>Atom Management>Shared Web Server
Then we have to concat the Base URL with the Simple URL path which we will find in the web service server operation.
Now we have to go to Postman to test our API and paste the concatenated URL inside the newly created request and click on Send and As the Http verb is Get we don’t have to send any body.
Step 25: We will get the response back in Postman and we can see the Response status code and Response time and the Response message too.
For this process which is deployed in bridge mode we can see the Response time taken to execute this process is 12 seconds.
For the same process when it is deployed in general mode and low latency let us see the Response time. For general mode it is taking around 24 seconds:
For low-latency mode it is taking around 13 seconds:
• In Bridge Mode we can see the process in Process Reporting and the logo is also different for Bridge Mode so we can easily recognize it
• We can see Process Logs in this mode as compared to low latency mode
• We cannot see the Process state
• We cannot see the in bound and out bound documents it will throw a pop-up like this
• We cannot Re-Run the documents in Test Mode
• We cannot see the Process Report Summary of the Process Deployed in Bridge Mode.